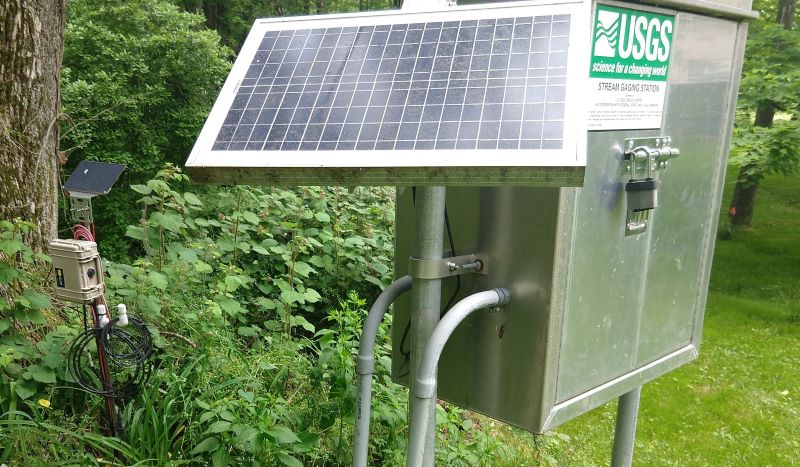
When it comes to the environmental sensors used in streams and rivers to monitor water quality and overall stream health, the U.S. Geological Survey’s streamgages are considered the gold standard. It’s no wonder why. The methods used to collect and manage USGS data from its network of more than 8,500 streamgages have been refined over more than a century (see Gauges Through the Ages).
While the network continues to expand, many communities throughout the United States — and more than 3 billion people globally, according to the United Nations — lack water quality data that helps to ensure public health and safety.
EnviroDIY is helping to change that, especially within the Delaware River watershed where more than 150 stations have been deployed thus far. The sensors included in these stations utilize technology that’s similar to that of USGS streamgages. They cost less. And, with some training, community science volunteers can maintain them and gain environmental insights from their real-time data, which can be viewed on the data-sharing portal Monitor My Watershed. But how accurate are they?
Did You Know? Some research has shown that where watershed groups are active, water quality is enhanced.
“There are many ways to compare sensor accuracy, precision, and response under controlled conditions,” writes Scott Ensign, Ph.D., in a blog post on EnviroDIY.org. Ensign is a research scientist and assistant director at Stroud Water Research Center. He compared data from field deployments at two sites in Chester County, Pennsylvania, where both USGS and EnviroDIY equipment are located next to each other: the Brandywine River at Chadds Ford and the east branch of White Clay Creek near Avondale.
Ensign analyzed real-time continuous data that lasted from 2 to 5 years. This allowed him to compare data under a wide range of environmental conditions.
The EnviroDIY Monitoring Stations at both sites use the Meter Group CTD sensor to collect temperature, conductivity, and depth data. The station at the White Clay Creek site also includes a Campbell OBS3+ Turbidity Sensor. Both sensors were used with their factory calibrations.
After downloading the raw data from Monitor My Watershed and subjecting it to quality control measures, Ensign compared it to data collected by the USGS streamgages’ In-Situ Aqua TROLL sensors across 15-minute intervals.
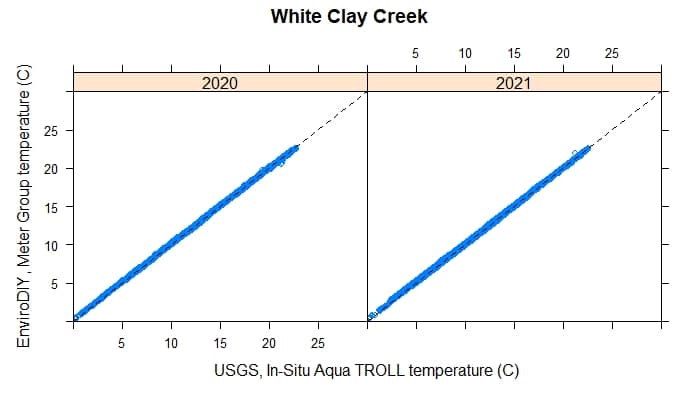
What did he find? Overall, a properly maintained EnviroDIY Monitoring Station can capture data that closely matches USGS streamgage data. Temperature data, for example, had less than 1 degree Celsius of difference between sets. However, the performance of some parameters appears to deteriorate over time, suggesting that the sensors should be replaced more frequently, possibly every three years. Furthermore, the data showed a greater difference in turbidity during storms, which might be improved by calibrating both sensors to the same standards.
For a more technical look at this analysis, read Ensign’s blog post on EnviroDIY.org.
To learn the origin story of EnviroDIY and the Mayfly Data Logger, check out “A Digital Mayfly Swarm is Emerging.”
Protect Clean Fresh Water
To monitor your local stream, join the EnviroDIY community and build your own monitoring station. You can also support the Stroud Center’s work to protect fresh water, including stream monitoring and the equipment and support we provide to watershed organizations for free: donate today.
This article was originally published on August 20, 2022, and was reposted with minor updates on December 4, 2024.