Most stream sites sampled this fall exceeded at least one environmental chloride guideline — months after the last road salt was applied.
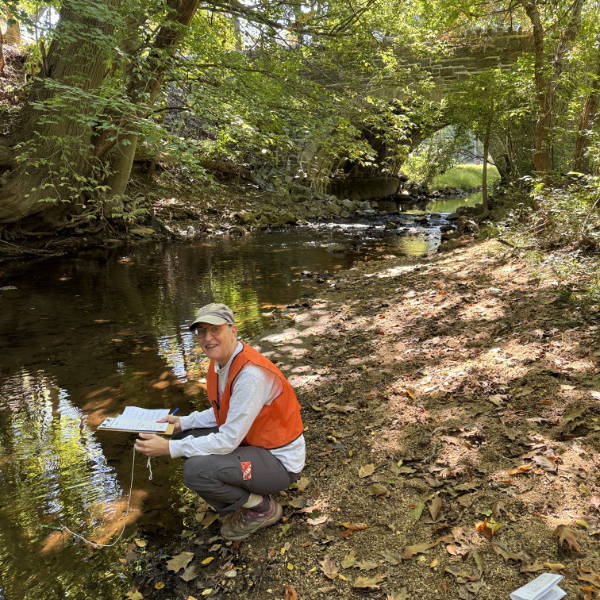
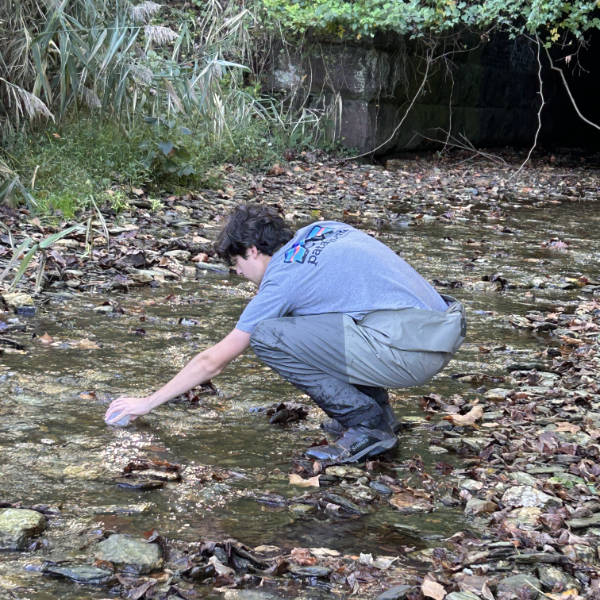
This surprising finding comes from the region’s first coordinated Fall Salt Snapshot, powered by community scientists working with dozens of partner organizations throughout the mid-Atlantic. Across Pennsylvania, Delaware, New York, and beyond, more than 700 volunteers stepped into creeks, neighborhoods, and forested valleys to help build a clearer picture of how much salt remains in our waterways long after winter has passed.
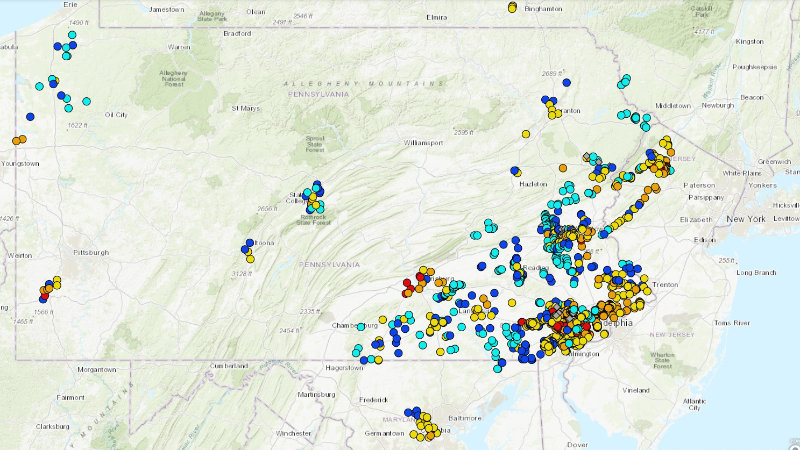
For the first time, these fall season results are being added to Stroud Water Research Center’s interactive salt pollution map, joining the Winter Salt Week dataset added in January 2025. Together, these seasonal snapshots are revealing not just where salt pollution occurs, but how it persists in groundwater and continues feeding into streams throughout the year.
Why Sample in October? A Clear Window Into Groundwater
Most people think of road salt pollution as a winter issue, but fall sampling reveals what winter storms leave behind.
By October, rainfall is low and streamflow comes mostly from groundwater. Because recent storms haven’t washed fresh road salt into waterways, the fall sample readings reflect what has seeped into aquifers over months or years, not recent runoff. This offers a high-quality look at long-term salt storage underground in our freshwater aquifers.
As Senior Research Scientist John Jackson, Ph.D., explained during the recap event on November 20 (recording available on YouTube), fall sampling allows scientists to separate chronic groundwater contamination from the short-lived peaks from winter runoff. This baseflow snapshot provides the clearest indication of how much road salt has penetrated the region’s water systems.
The Largest Fall Sampling Effort in Our Network
This year’s Fall Salt Snapshot was the largest fall-season chloride sampling event ever coordinated across the Stroud Center’s regional network, generating about 1,200 sampling locations, mostly during the coordinated window of October 1-15.
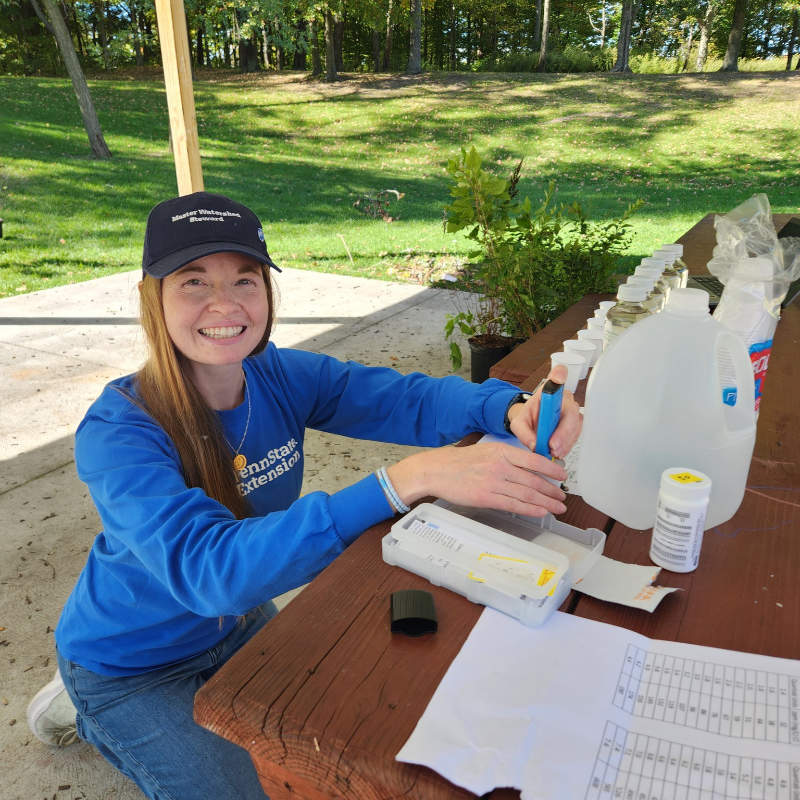
This effort was unique: it is the first time so many mid-Atlantic partner organizations collected fall data within the same narrow sampling window and contributed those readings to the salt data map.
Collecting data simultaneously creates a high-resolution, moment-in-time picture of groundwater chloride — something year-round datasets cannot produce. Patterns that would otherwise be blurred by local weather variation and geography become much clearer when thousands of readings are collected almost at once.
The samples spanned:
- Urban centers with dense road networks, where the most contaminated streams are often found.
- Suburban communities shaped by heavy winter maintenance.
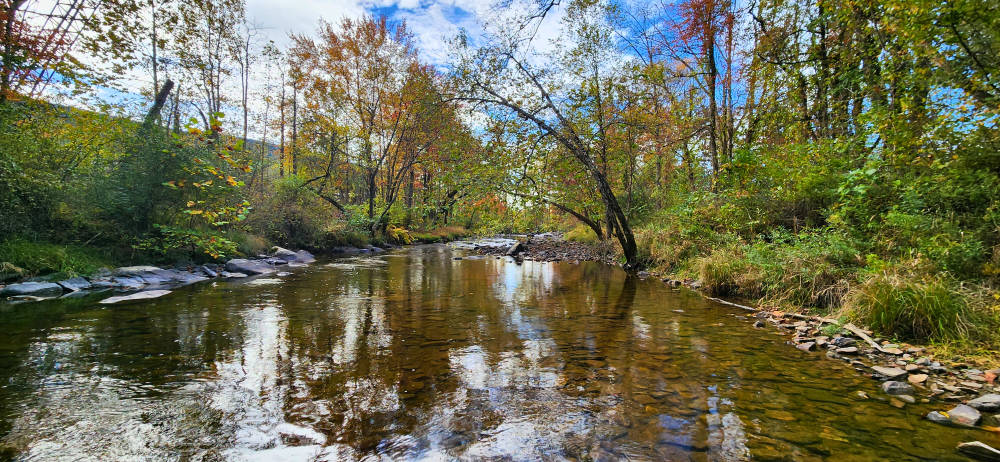
- Rural headwaters where early signs of contamination are most detectable.
What the Data Show: Salt Persists and Accumulates
The fall data reveal several striking trends:
1. Most sampled sites exceeded at least one chloride guideline.
More than 700 locations — 61% of all sites sampled — surpassed aquatic life thresholds established by the EPA, Canada, or newer Maryland/Ohio standards.
Because no salt had been applied for months, these elevated results point to significant long-term groundwater contamination.
2. High-salt hotspots emerged across the region.
Volunteers documented 64 chloride hotspots with levels greater than 230 milligrams per liter, many surrounded by halos of moderately elevated readings, suggesting heavy winter salt use, groundwater migration, or downstream transport.
Of those chloride hotspots, 54 exceeded Pennsylvania’s drinking water standard for chloride (250 mg/L).
Using chloride to estimate sodium, the data also show a broader pattern worth attention. Once chloride levels reach about 50 milligrams per liter — the level where sodium becomes a concern for people on a very low-salt diet — an estimated 697 sites (about 60% of sites sampled) were above that point.
3. Even rural headwaters show concerning signs.
While lower than urban readings, many suburban and rural sites fell in the “medium” range. These are exactly the places where early action could prevent long-term accumulation into the “high” range.
4. Evidence points to deep groundwater storage.
Jackson noted that deeper aquifers have been found to accumulate chloride slowly but steadily. Elevated fall readings that appear even in dry conditions reflect contamination coming from older, deeper groundwater rather than surface or shallow influences.
And the salt that lingers may be the most harmful. Research shows salt is more toxic to aquatic life in warm conditions, which means chronically elevated chloride concentrations in spring, summer, and fall may be more dangerous than wintertime spikes to stream health.
How Fall Readings Compare to Last Winter’s Salt Snapshot
Last winter’s Salt Week showed the impact of both winter storm spikes and chronic groundwater contamination. This fall isolates the problem of chronic groundwater contamination.
In January 2025, more than 700 volunteers sampled 600 sites during active salting. The results were extreme:
- Over 70% of winter samples exceeded at least one chloride limit — even higher than fall’s 58%.
- The top winter level was estimated as high as 15,900 milligrams per liter, more than 18 times the highest recommended acute limit.
- This fall’s maximum reading — 919 milligrams per liter — is far lower, but still above several chronic thresholds.
Together, these datasets reveal how the rise in road salt use over recent decades threatens drinking water sources year-round.
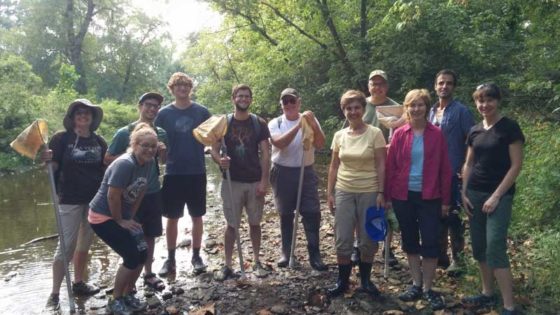
Why Volunteers Matter
This fall snapshot was only possible because volunteers could sample hundreds of places researchers could not reach on their own. Their work:
- Generates hyper-local data for communities.
- Allows sampling to occur at the same time across a wide geography, revealing patterns across watersheds and regions.
- Identifies priorities for salt-reduction efforts.
- Brings scientific findings into public conversation.
- Makes the invisible impacts of road salt tangible to local and regional decision-makers.
- Provides real science experience to participants, including schools and university students.
Looking Ahead: Winter Salt Week 2026 and Beyond
The next major milestone is Winter Salt Week, returning in January 2026. Winter Salt Snapshot data helps communities see how winter road salt use affects local streams and groundwater by showing:
- How salty waterways become during and after storms.
- Differences in salt use and impacts across towns.
- When and where salt pollution appears during winter.
- Places where salt levels are unusually high.
- Likely sources of contamination, such as busy roads or large parking areas.
- How winter readings compare to fall’s groundwater baseline.
Taken together, the fall and winter snapshots create a powerful seasonal picture that communities can use to adjust practices, protect streams, and make more informed winter maintenance decisions.
Thanks to volunteers, donors, and partner organizations, the Fall Salt Snapshot has created the strongest fall-season chloride baseline the mid-Atlantic has ever had. Winter Salt Week will build on this foundation, advancing a clearer, more actionable understanding of how salt moves through our water and how we can work together to reduce its impact.
Take Action: Want to help reduce salt pollution in your community? Find tips, tools, and upcoming volunteer events at stroudcenter.org/salt.