The White Clay Watershed Association’s (WCWA) Stream Watch Program was initiated by WCWA volunteers and Stroud Water Research Center, and later joined by the Delaware Nature Society, because of concerns of rapid land development in the WCC watershed.
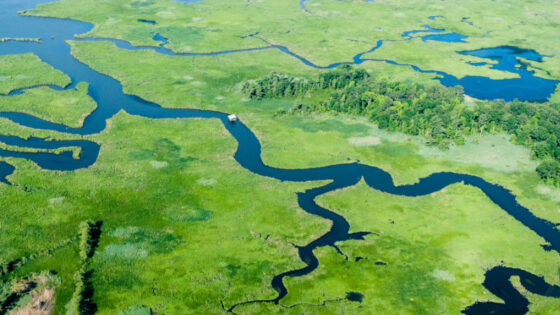
The White Clay Creek watershed (107 square miles or 280 km2) is located in Chester County, Pennsylvania and New Castle County, Delaware. It flows into the Christina River near Newport, Delaware, which in turn, flows into the Delaware River near Wilmington. The White Clay Creek (WCC) is composed of three main branches in Pennsylvania (East, Middle, and West) and three main tributaries in Delaware (Middle Run, Pike Creek, and Mill Creek).
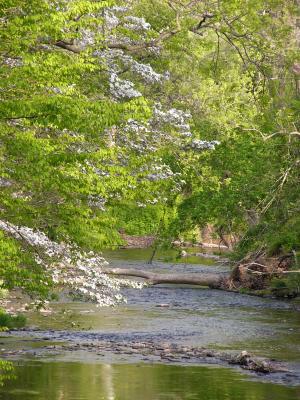
In 2000 Federal legislation designated WCC and its tributaries as a National Wild and Scenic River signifying it as possessing outstanding scenic, wildlife, recreational and cultural value. That marked the first time an entire watershed — rather than just a section of river — had been designated.
Approximately 17% of the watershed is protected open space including the WCC Preserve (PA) and WCC State Park (DE). A variety of habitats provide a rich diversity of fish and wildlife: 21 species of fish, 33 species small mammals, 27 species of reptiles and amphibians, and over 90 species of breeding birds.
It is also a cultural and historic location that was originally settled by the Lenape Native Americans and presently has 38 properties on the National Register of Historic Places. In addition, nearly 130,000 people get their drinking water from the WCC and the Cockeysville aquifer that underlies portions of the watershed.
- For full project summary and results by site, download the final report.
- Download the brochure.
Project Goals
The goals of this project were:
- To evaluate water quality in White Clay Creek and its tributaries using aquatic macroinvertebrates, and
- to make data available to local education outreach and community groups in order to encourage efforts to assess, improve, and/or protect water quality in White Clay Creek.
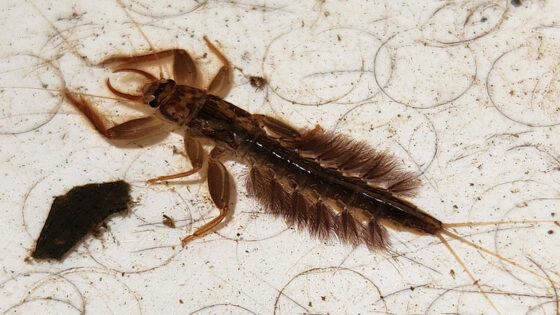
Macroinvertebrates
Sampling of aquatic macroinvertebrates (insects and non-insects such as worms and mollusks) was chosen because they have been shown to be cost-effective, commonly used, and widely accepted tool in water quality monitoring programs. Macroinvertebrates are advantageous in evaluating water quality because they have relatively diverse assemblages (100-200 species) and as a group are a sensitive measure of environmental change and stress. Their limited mobility and relatively long life spans (a few months to a year) make the presence or conspicuous absence at a site a meaningful record of environmental quality during the recent past, including short-term infrequent events that might be missed by periodic water sampling.
Macroinvertebrate sampling started in 1991 and has continued through 2008 with 15 of the last 18 years sampled. A total of 18 sites were monitored: A total of 18 sites were monitored: 12 sites in PA were sampled ~15 yrs (1991-2008), three sites in DE were sampled ~9 yrs (1995-2008), and three sites were sampled infrequently.
Samples were taken in riffle habitat using a Surber sampler (250-µm mesh, 0.093m2). This is a quantitative method of determining the numbers and kinds of macroinvertebrates found on the stream bottom. To dislodge attached organisms rocks within the sampler were scrubbed using a brush and sediments were disturbed. Four samples were taken at each location, except in 1991 and 1992 when two samples were taken. Samples were rinsed through a 1-mm mesh sieve, transferred to a labeled jar, and preserved with 95% ethanol.
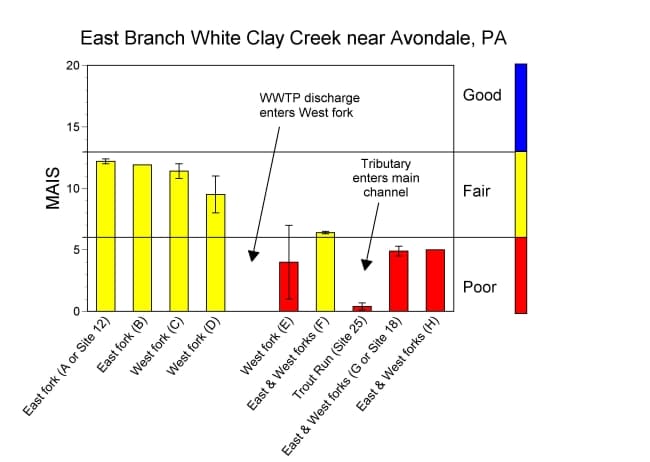
Eight sites on the East Branch in the Avondale area were sampled in October 2005 by Avondale High School student, Dylan Kee, under the direction of Stroud Water Research Center. Data was collected and processed in comparable way to other Stream Watch data with the exception of two composite samples instead of four individual samples. In addition, Trout Run (Site 25), a tributary that joins the East Branch in Avondale, was sampled a single time in March 2005.
In the laboratory, a microscope was used to remove ≥200 organisms from detritus material and these individuals were identified usually to family (except in 1991-1993 when many taxa were identified to order), counted, and recorded. In years when samples contained many individuals, only a portion of each sample (e.g., 50%) was processed. Sampling procedures were designed and described in a matter that volunteers with minimal training could collect and process the samples. These protocols are available by contacting the education department at Stroud Water Research Center.
Chemistry
Water chemistry was examined in 1994-1997, 2003-2005, and 2008 (i.e., 8 of the 15 years). Nitrate, ammonium, and soluble reactive phosphorus were measured in all 8 years, but other variables were sampled less often.
| Year | Nitrate | Ammonium | Total Phosphorus | SRP | Sulfate | Alkalinity | pH | Conductivity | Dissolved Organic Carbon |
|---|---|---|---|---|---|---|---|---|---|
| 1994 | X | X | X | X | X | ||||
| 1995 | X | X | X | ||||||
| 1996 | X | X | X | X | X | X | X | ||
| 1997 | X | X | X | X | X | X | |||
| 2003 | X | X | X | X | X | X | X | X | |
| 2004 | X | X | X | X | X | X | X | X | |
| 2005 | X | X | X | X | X | X | X | X | |
| 2008 | X | X | X | X | X | X | X | X |
Land Use
Sampling sites were located with a handheld Garmin 60CS GPS unit and geographic data was mapped with ArcMap (version 9, Environmental Systems Research Institute, Redlands, CA). Watershed boundaries were obtained from the Delaware Valley Regional Planning Commission and a Delaware topoquad obtained from U.S. Geological Survey. Some additional digitizing was done using 7.5 minute digital topoquads. Data layers (land use/cover, imperviousness, and canopy cover) were obtained from the 2001 National Land Cover Data at a resolution of 30-m. Population data (1990 and 2000 Census data) were obtained from the National Historic Geographic Information System. Data layer of PA DEP impaired sites was obtained from www.pasda.psu.edu (accessed 28 Sept 2010).
Data Analysis
Certain macroinvertebrates are sensitive to pollution, while others are highly tolerant of it. The number and diversity (richness) of pollution-sensitive (e.g., mayflies, stoneflies, caddisflies) and pollution-tolerant macroinvertebrates (e.g., midges, black flies, worms) can be used to describe water quality conditions. Because the macroinvertebrate samples were collected from a known area of stream bottom the data could be summarized as a density (individuals/m2) for individual families or groups of families.
Not all macroinvertebrates were identified to the family level because of specimen size, damage, or taxonomic limitations. Thus, our estimates of richness may slightly underestimate actual richness. From 1991 to 1993 macroinvertebrates were, in part, only identified to order because volunteers were still learning identification skills.
Besides density of certain macroinvertebrate groups, water quality conditions can also be described by various metrics that are commonly used in water quality monitoring programs. Metrics take in to account diversity (richness) and/or composition (percentages) of certain macroinvertebrate groups. Many metrics can be combined to create an index (e.g., Macroinvertebrate Aggregated Index for Streams (MAIS)), a single value that rates water quality for that site).
Density
The quantitative sampling method allowed macroinvertebrate counts to be expressed as a density (e.g., individuals/m2) that was used to compare across sites and years. We examined densities of pollution-sensitive taxa [e.g., many Ephemeroptera (mayflies), Plecoptera (stoneflies), Trichoptera (caddisflies)] and pollution-tolerant taxa [e.g., many Diptera (true flies), Odonata (dragonflies, damselflies), Coleoptera (beetles)]. In response to moderate exposure to pollution, a decrease in density of pollution-sensitive taxa accompanied by an increase in density of pollution-tolerant taxa would be predicted.
Densities of Ephemeroptera, Plecoptera, and Trichoptera (EPT) are commonly pooled together and analyzed as a group to assess changes in water/habitat quality in streams and rivers. Species in this group are generally more pollution-sensitive than other taxa; thus, a decrease in EPT density would be predicted in response to moderate exposure to pollution. All density data were natural logarithm transformed, a standard procedure to correct for the clumped spatial dispersion of invertebrate populations in rivers.
MAIS Index
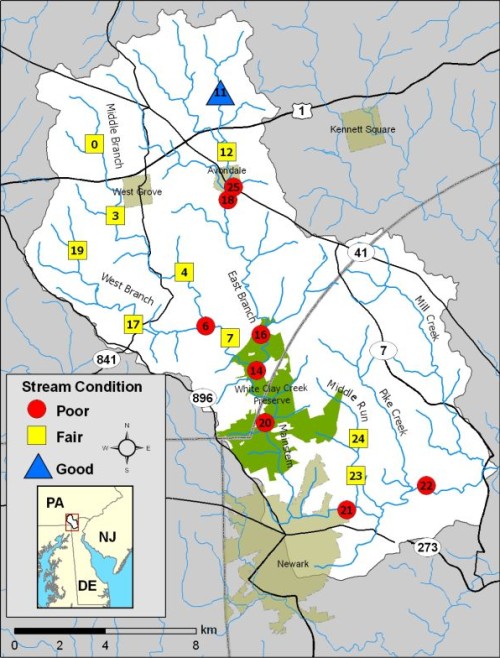
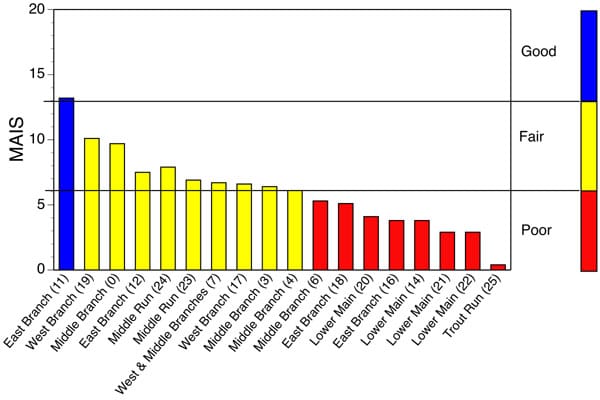
To classify stream condition using the macroinvertebrate data, we calculated a Macroinvertebrate Aggregated Index for Streams (MAIS) that uses family level identification that integrates various types of information into a single number that can be used to compare streams. It summarizes the values of 10 metrics: Ephemeroptera Richness, EPT Richness, Intolerant Taxa Richness, % Ephemeroptera, % EPT, % 5 Dominant Taxa, Simpson Diversity, Hilsenhoff’s Biotic Index (HBI), % Scrapers, and % Haptobenthos. Values for the individual metrics are transformed into a score of 0, 1 and 2, and then combined into a MAIS score. MAIS scores are predicted to decrease in response to a decrease in water/habitat quality. Streams are classified based on MAIS scores as follows:
- 13.1-20 classify a site as “Good”
- 6.1-13 classify a site as “Fair”
- 0-6 classify a site as “Poor”
Summary
The exact cause(s) of degradation at various locations in WCC are not known, but often stream degradation can be linked to the human uses of water and land. Land use is variable in the watershed but mainly rural (agriculture) in PA and mostly suburbanized (homes and industry) in DE. As the watershed becomes larger (moving downstream) water conditions become more degraded corresponding to an increase in impervious surfaces (parking lots and roads), and developed areas (buildings). It is important to recognize that water conditions are Poor in the Upper Branches in PA before it ever reaches the Lower Mainstem. Therefore, Poor conditions in the lower half of WCC should not be attributed solely to local land use changes or an increase in population density. Data from sites in the East, West and Middle Branches showed that as the number of people and the amount of developed land in the watershed increased the water quality decreased.
Sites on the East Branch suggest that water quality degrades in the vicinity of Avondale. Land use changes and point source discharges that occur in this area include the increased population density of the borough, a golf course, the wastewater treatment plant, and other non-point sources (e.g., residential areas and agriculture, including mushroom facilities). The East Branch remains poor south of Avondale and even with the addition of the West and Middle Branches, which were mainly rated as Fair, the main channel remains Poor. The large forested areas in the state parks in PA and DE also do little to improve the water quality of the Lower Mainstem through Delaware. Apparently in this case, large forests do not correct stream degradation that begins upstream. Further studies may want to ascertain the specific influences that are negatively impacting the East Branch and propose suggestions for their remediation or prevention.
Compared to 150 sites in the nearby Schuylkill River basin the WCC watershed has fewer Good sites and more Poor sites. The lower water quality in the WCC compared to the Schuylkill watershed appears to be related in part, to the lower amounts of forest and higher amounts of agriculture in WCC watershed. Compared to long-term data (1972-2009) for exceptional value or high quality streams in the Schuylkill watershed, water quality in the upper WCC watershed was lower than some creeks (French and Pickering), but comparable to others (Valley). Within each site water quality varied over time, but there were no trends in our data or data from four USGS sites indicating conditions have improved or become more degraded from 1994 to 2009; although, the USGS sites showed that water quality has markedly improved since 1972.
Water Quality
The Macroinvertebrate Aggregated Index for Streams (MAIS) uses the presence and relative abundances of certain macroinvertebrates, combined with knowledge of their ability to withstand pollution to come up with a water quality “score” for each site. This MAIS score is used to classify streams on a continuum from Good to Fair to Poor.
Of the 18 long-term monitored sites, only one (Site 11) was rated as having Good water quality, 9 sites were Fair, and 8 sites were Poor.
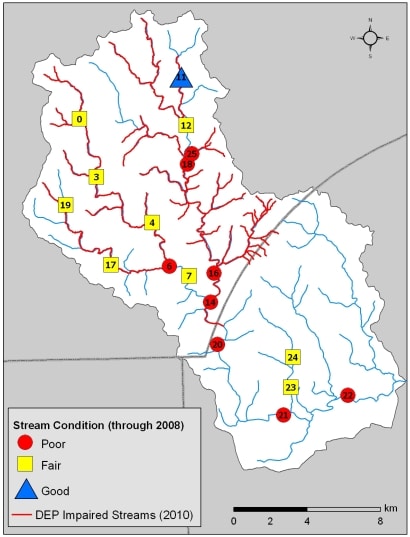
All headwater sites (Sites 11, 0, 19) rated higher water quality than downstream locations and all sites on the Lower Mainstem were Poor indicating degraded water quality.
Stream Watch results agreed with the assessment by the Pennsylvania Department of Environmental Protection and Delaware Department of Natural Resources and Environmental Control: water quality in WCC is impaired.
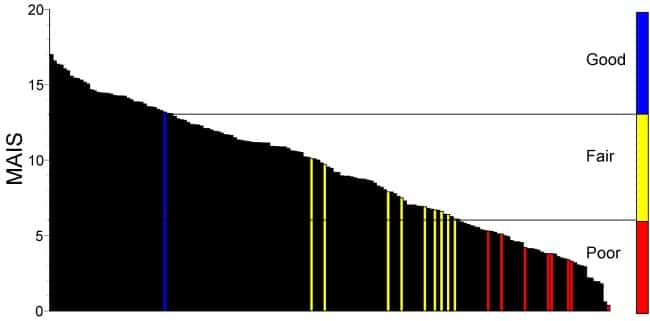
Comparing White Clay Creek to Other Streams
A comparison of WCC sites to 150 sites in the neighboring Schuylkill watershed indicated fewer Good sites and more Poor sites in WCC even though both watersheds have comparable land use.
Many of the WCC sites compared to the worst, most highly disturbed sites in the Schuylkill. For more info on the Schuylkill watershed visit our Schuylkill Project pages.
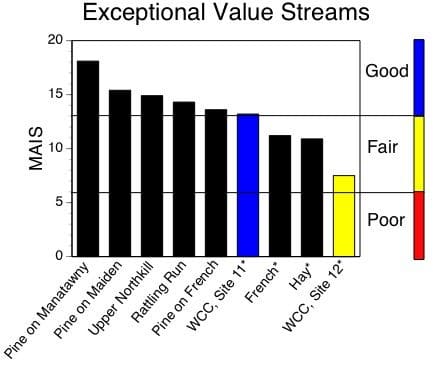
Sites 11 and 12 are located on the East Branch of WCC which has been classified as “Exceptional Value” by the state of Pennsylvania. Unfortunately, only Site 11, and not Site 12, appears to have a macroinvertebrate assemblage that is comparable to other EV streams in the region.
Changes Over Time
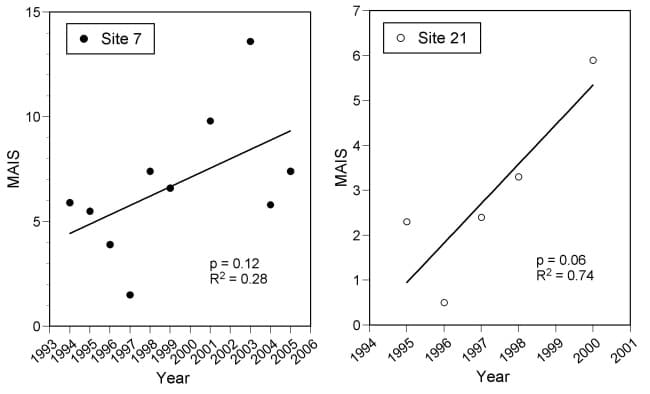
Within each site, water quality varied over time but there were no trends indicating sites have improved or become more degraded since 1991.
Only Site 7 below the Middle and West Branches and Site 21 on the Lower Mainstem show signs of possible improvement.
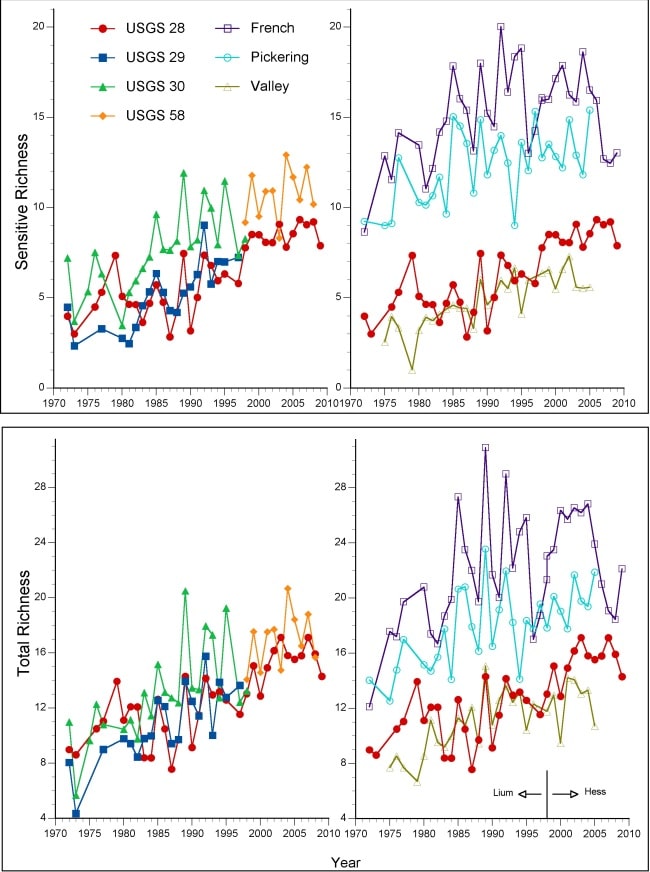
Long-term datasets from USGS suggest that water quality in the upper WCC has gotten better since 1972. The trend of improved water conditions was also observed for some long-term sites in the Schuylkill watershed.
Comparison of USGS long-term data for WCC and sites considered some of the best in the Schuylkill watershed indicated conditions in the East Branch of WCC and Valley Creek, are not as good as those in French and Pickering Creeks. Presently, sites on the upper WCC are comparable to conditions observed on French and Pickering Creeks in the 1970’s and 80’s.
Overall results suggest water quality in WCC has improved significantly since 1972, but that since 1994 the change, if any, is occurring at a less dramatic rate.
Land Use
White Clay Creek
White Clay Creek (WCC) watershed is a combination of forests (22%), agriculture (51%), and development (13%). Land use is variable in the watershed but mainly rural (agriculture) in Pennsylvania and mostly suburbanized (homes and industry) in Delaware.
Analyses indicated good water quality in the headwaters but as the watershed becomes larger water conditions became more degraded corresponding to an increase in impervious surfaces (e.g., parking lots and roads), and developed areas (e.g., buildings).
Poor water quality conditions in the lower mainstem of WCC should not be attributed solely to changes in land use since water quality is Poor below the east, west and middle branches, including sites in the forested state parks, before it ever reaches the heavily populated and developed area of Newark, Delaware.
White Clay Creek and Schuylkill Watersheds
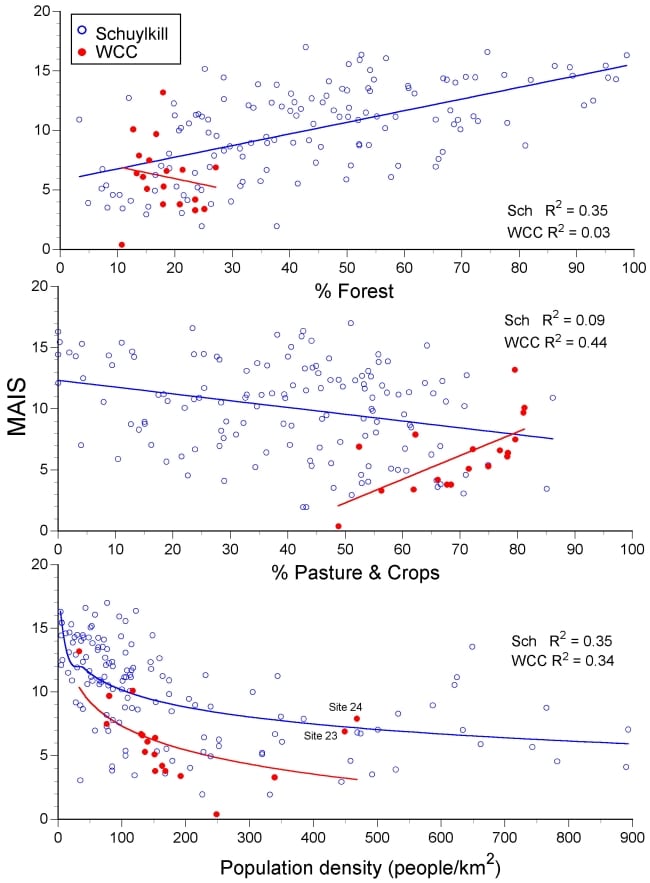
An analysis of WCC sites and sites in the Schuylkill watershed showed that more forests and less agriculture in the watershed resulted in higher water quality.
In the Schuylkill watershed there is a clear relationship between forest, agriculture, and water quality, but this pattern is less clear for the WCC watershed.
Contrary to expectation some of the best water quality sites in WCC have the highest percentage of agriculture and lowest forest.
The relationship between population density and MAIS also differs between watersheds: water quality is much more degraded in the WCC watershed compared to the Schuylkill for a given population density.
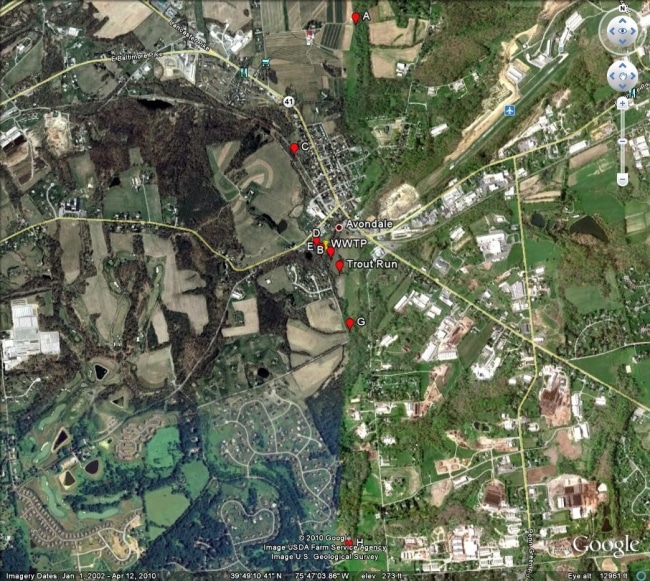
Impacts at Avondale
In 2005 an intensive survey was done on the East Branch in and around the borough of Avondale. Macroinvertebrates indicated that the Avondale Waste Water Treatment Plant (WWTP) on the west fork of the East Branch appears to be a major contributor to stream degradation. Trout Run (Site 25), a tributary below the plant, is also in very poor condition.
USGS data suggest water quality directly below the WWTP improved between 1992 and 1997, but has since degraded from 1997 to 2004. Further sampling is needed to assess if the upgrades to the WWTP in 2006 have measurably improved water quality.
References
- Elliott, J. M. 1977. Some methods for the statistical analysis of samples of benthic invertebrates, 2nd Edition. Freshwater Biological Assoc. Sci. Publ. No. 25. 156 pp.
- Smith, E. P. and J. Voshell, J.R. 1997. Studies of Benthic Macroinvertebrates and Fish in Streams within EPA Region 3 for Development of Biological Indicators of Ecological Condition. Part 1. Benthic Macroinvertebrates. Final report for Cooperative Agreement CF821462010. U.S. Environmental Protection Agency, Washington, D.C.
- Boyer, MA, 1997, Aquatic Biology Investigation — East Branch White Clay Creek. Case: Avondale STP/Non-Point Sources. PA DEP Report:
- Stribling, J. B., B. K. Jessup, J. S. White, D. Boward and M. Hurd. 1998. Development of a Benthic index of Biotic Integrity for Maryland Streams, Chesapeake Bay and Watershed Programs. Report no. CBWP-EA-98-3. 62 pp.
Acknowledgments
The data collection and macroinvertebrate identification were accomplished with the help and dedication of multiple volunteers from the White Clay Watershed Association, Stroud Water Research Center, and the Delaware Nature Society.
This report and web pages development were prepared for the White Clay Creek Watershed Management Committee (White Clay Wild & Scenic Program) with funding provided by the National Park Service Wild and Scenic Rivers Program and Stroud Water Research Center endowment funds. The views and conclusions contained in the document and web pages are those of the authors and should not be interpreted as representing the opinions or policies of the U.S. Government. Mention of trade names or commercial products does not constitute the endorsement by the U.S. Government.