Low-Cost, Open-Source Data Collectors and a Suite of Collaborative Online Tools Are Making Big Leaps in the Field of Watershed Monitoring.
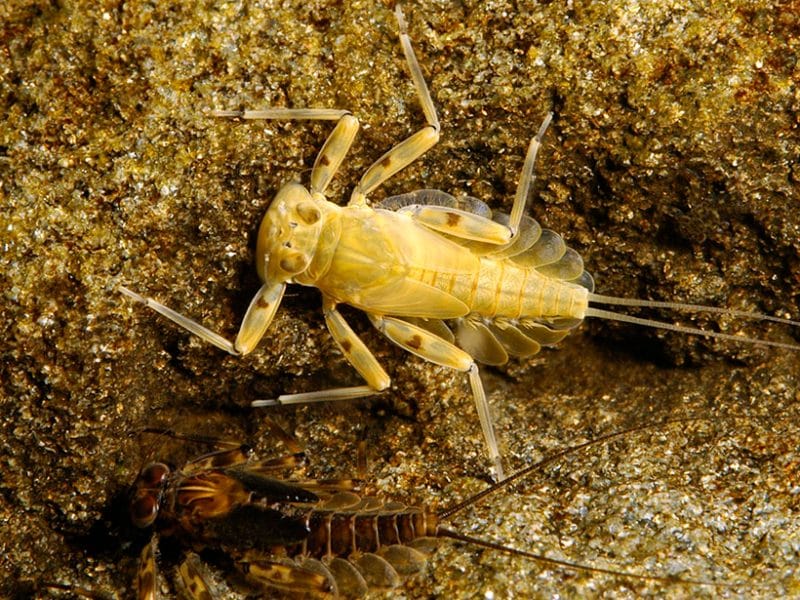
The mayfly Epeorus pleuralis, after which a new water sensor is named. Credit: David Funk
By Scott Ensign, David Arscott, Shannon Hicks, Anthony Aufdenkampe, Tara Muenz, John Jackson, and David Bressler
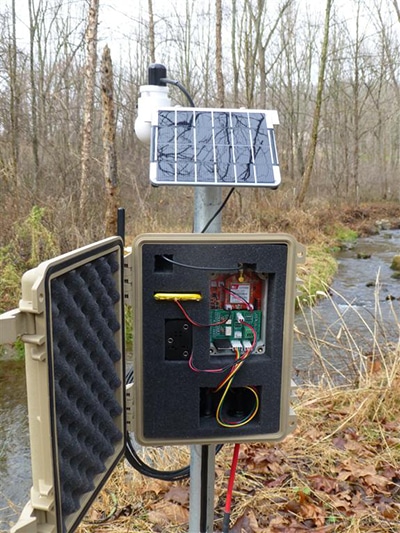
An EnviroDIY Mayfly Data Logger sensor station on the bank of White Clay Creek in Pennsylvania. Credit: Shannon Hicks
A swarm of Mayflies is spreading from the Delaware River basin, but we’re not talking about fish food. Instead, autonomous, low-cost, open-source EnviroDIY Mayfly Data Logger sensor stations (Figure 1) are being deployed in streams, rivers, lakes, estuaries, and stormwater infrastructure to measure water quantity and quality. Tethered by cables to sensors underwater, these electronic sentinels stand inconspicuously on the bank of the waterway and stream data to users in real time from the cloud.
The Mayfly project started nine years ago at Stroud Water Research Center in Avondale, Pa., in an effort to reduce the cost of sensor-based monitoring of streams and soils. Five years later, following successful development and application of the Mayfly Data Logger for environmental monitoring in Avondale, the Stroud Center shared the device with the broader research community, which has adopted it for a wide variety of applications across the United States.
In addition to lowering the cost of environmental monitoring with open-source, do-it-yourself tools, the project has expanded to facilitate science, technology, engineering, and mathematics (STEM) education; citizen science; and community-driven innovation, environmental modeling, and data sharing.
More Data, Better Data, Lower Cost
With 5.6 million kilometers of streams in the United States and 40,000 monitoring locations, only 1% of the nation’s stream kilometers are being monitored.There are more than 40,000 water quality monitoring stations across the United States that are maintained by agencies and private entities. Assuming an average cost of $10,000 per station, there is over $400 million of water quality measurement infrastructure in place across the country. Add in labor costs for maintaining these systems, and the annual cost of monitoring in the United States rises to $656 million [Diment, 2015]. Even with this large investment, there is still a consensus by scientists and water managers that our efforts at studying and managing water quality are data limited, particularly in a spatial context:
Given the 5.6 million kilometers of streams in the United States and 40,000 monitoring locations, only 1% of the nation’s stream kilometers are being monitored.
Open-source hardware and software, such as that used in the Mayfly Data Logger, are part of the solution to this shortage of data on streams and rivers. Using open-source development environments like Arduino, collaborative online tools like GitHub, and counterpart open-source hardware sites and inexpensive prototyping services, engineers, scientists, citizens, and students are developing environmental monitoring devices as a user community. New do-it-yourself (DIY) science projects are being introduced every day on platforms such as Public Lab, Instructables, and Ardupilot. Combining commercially produced, lower-cost, high-accuracy sensors with low-cost, user-programmable data loggers is decreasing the cost of water monitoring and increasing the public’s access to monitoring tools.
However, high-accuracy measurements do not necessarily translate into high-value data. It takes user-driven adaptation of the technology, systematic application and quality control, and standardized metadata formats to maximize data value for science and management. In the end, the value of water data is only as strong as the weakest link in the measure-validate-disseminate chain of actions. The Mayfly Data Logger project originally focused on the measure-validate link in this chain, but it has evolved as a tool that also strengthens the validate-disseminate link by enabling users to share their data and documentation across digital platforms.
The Mayfly Emerges
In 2009, scientists at Stroud Water Research Center in collaboration with the University of Delaware began the Christina River Basin Critical Zone Observatory research program. The team was charged with developing an instrumented watershed but had a budget of only $25,000 for data loggers and miscellaneous sensors. Instead of relying on commercial products, the Stroud Center’s in-house engineering team developed their own open-source data logger as a partial substitute, thus saving substantial resources and allowing a greater proportion of the budget to be spent on additional bare-wire sensors to increase the spatial resolution of sampling in the White Clay Creek watershed in Pennsylvania.
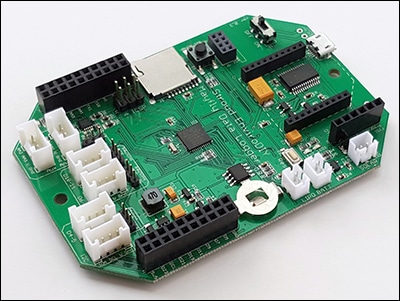
EnviroDIY Mayfly Data Logger. Credit: Shannon Hicks
The Mayfly Data Logger (Figure 2) [Hicks et al., 2013] that emerged from this effort (now in its fifth generation) can manage dozens of sensors or linked devices, can relay data via cell modem, wi-fi, or radio, and is powered by a solar panel and lithium-ion battery. A typical Mayfly Data Logger sensor station consists of two parts: waterproof housing for the microcontroller and battery and connection to a customizable selection of commercially available bare-wire sensors such as temperature, conductivity, water pressure (depth), turbidity, dissolved oxygen, soil moisture, light, and precipitation sensors. All sensors are commercially available products with well-documented accuracy and precision.
Following the expansive deployment of the Mayfly Data Logger for in-house research, the Stroud Center received strong interest in the project from the science community. To help jump-start this DIY effort, the Stroud Center also (1) launched EnviroDIY, a community-driven idea exchange and social networking website, (2) made the device available for retail sale on Amazon, and (3) developed an online visualization and data-sharing portal. These pieces were ready in 2016 to support the launch of a new, watershed-scale program in the Delaware River Watershed.
A Model for DIY and Citizen Science–Driven Water Monitoring
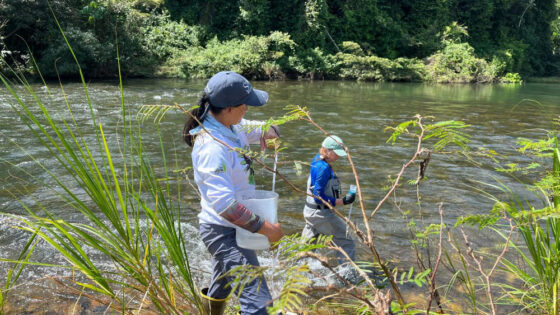
The Delaware River Watershed hosts one of the largest nonregulatory water conservation efforts in the United States. The Stroud Water Research Center and more than 50 nongovernmental organizations are partnering to implement agricultural and urban stormwater best-management practices and land protection projects to improve water quality as part of the Delaware River Watershed Initiative. Monitoring teams are responsible for helping to define scientific questions at a specific stream, installing and maintaining monitoring equipment, collecting water samples, and tracking progress toward results.
Access to real-time data helps inform timing of supplemental water quality sampling, particularly during storm events or unexpected changes in conductivity or turbidity.
To support this effort, the Stroud Center and partners have organized a basin-wide, citizen science monitoring program that reduces costs by utilizing the Mayfly Data Logger. Sensor station installation generally begins with a workshop to train scientists, students, and citizens how to build, program, install, and maintain the monitoring stations. Serving real-time data to the Web allows individuals who manage a sensor station to monitor for fouling and instrument drift, which provides the opportunity to correct problems in the field promptly and minimize data loss. Additionally, access to real-time data helps inform timing of supplemental water quality sampling, particularly during storm events or unexpected changes in conductivity or turbidity that may signal discrete pollution events.
To date, more than 25 workshops have introduced over 500 people to the process of programming, building, installing, and managing water quality monitoring equipment. This effort has resulted in the deployment of more than 60 Mayfly Data Logger sensor stations funded by the Delaware River Watershed Initiative and more than 150 internationally. The Stroud Center is now expanding this model to citizen science and STEM education programs on a national level. The training workshops have also allowed simultaneous development of a STEM model curriculum around electronics, coding, and environmental monitoring. Supported by an EPA Environmental Education National Model grant, the Mayfly-based DIY environmental science model is now being developed into regional teaching curriculums for eighth grade through the undergraduate level.
Maximizing the Value of Water Data
The ultimate value of water data for scientists, managers, and the public is determined by (1) the extent to which measurements can characterize an environmental condition, (2) the quality of documentation validating the measurements, and (3) dissemination and accessibility of the data. To maximize the value of water data produced by the Mayfly hardware, the Stroud Center partnered with colleagues to develop a Web-based suite of data capture, display, query, and modeling tools. This suite, the WikiWatershed, helps strengthen all the links in the measure-validate-disseminate chain. Mayfly-derived data are transmitted to the Monitor My Watershed website (Figure 3) and can be visualized; quality can be documented, and the results can be shared with a variety of Web-based mapping and cataloging services such as the Consortium of Universities for the Advancement of Hydrologic Science’s Data Services.
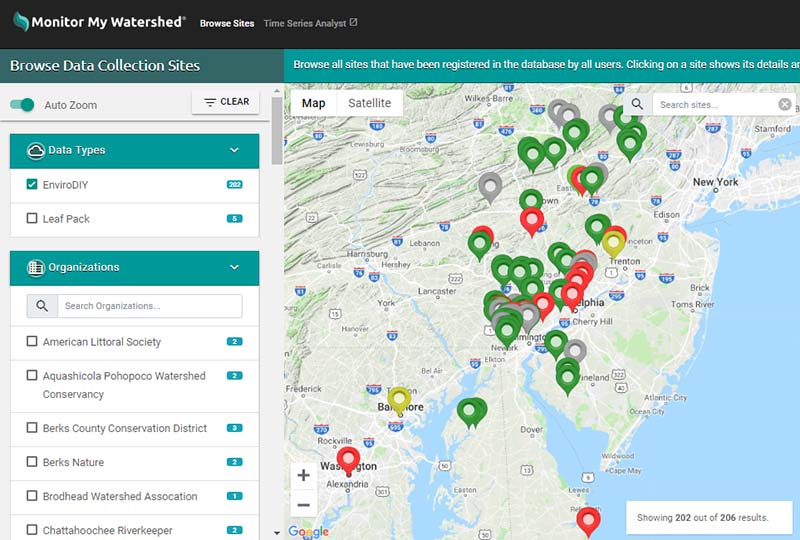
Map of sensor stations reporting data to the Monitor My Watershed data portal.
The Mayfly Data Logger has been adopted by a large user community because a training and education curriculum could be built around it.
The Stroud Center accelerated the rapid development of a DIY water monitoring community with a customized hardware platform made available for purchase at low cost. The Mayfly Data Logger has been adopted by a large user community because a training and education curriculum could be built around it. Real-time monitoring and Web-based tools help to strengthen the measure-validate-disseminate links in the Internet of Water chain. Strengthening these links is particularly important for citizen science efforts where sensor data quality has been challenging to document and disseminate across multiple Web-based platforms.
Acknowledgments
Funding for EnviroDIY and the Mayfly Data Logger was provided by EPA grant NE-83675001-0 and William Penn Foundation grant 158-15.
References
- Diment, D. (2015), Environmental consulting industry in the US, IBISWorld Ind. Rep. 54162, IBISWorld, New York.
- Hicks, S., et al. (2013), An open-source wireless sensor stack: From Arduino to SDI-12 to Water One Flow, Abstract H43H-1572 presented at the 2013 Fall Meeting, AGU, San Francisco, Calif., 9–13 Dec.
Author Information
Scott Ensign, David Arscott, and Shannon Hicks, Stroud Water Research Center, Avondale, Pa.; Anthony Aufdenkampe, LimnoTech, Ann Arbor, Mich.; and Tara Muenz, John Jackson, and David Bressler, Stroud Water Research Center, Avondale, Pa.
Citation: Ensign, S., D. Arscott, S. Hicks, A. Aufdenkampe, T. Muenz, J. Jackson, and D. Bressler (2019), A digital Mayfly swarm is emerging, Eos, 100, https://doi.org/10.1029/2019EO116611.
Text © 2019. The authors. CC BY-NC-ND 3.0
Except where otherwise noted, images are subject to copyright. Any reuse without express permission from the copyright owner is prohibited.