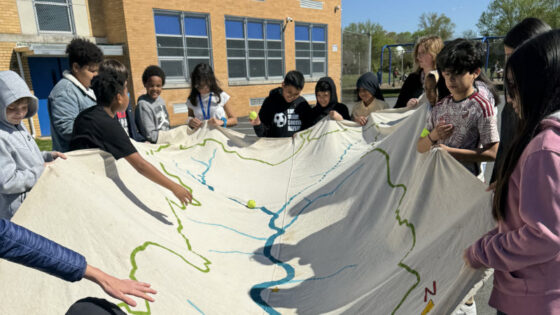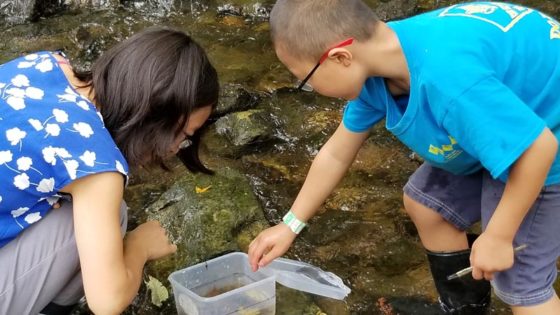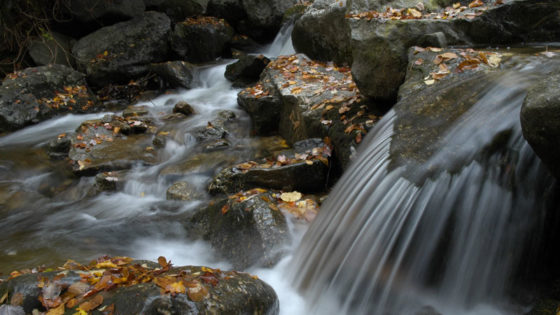

Tools Behind the Science is a series exploring innovative technologies developed by Stroud Water Research Center that make freshwater science possible. From open source hardware and software to data platforms, these tools help researchers, educators, and communities better understand and protect our rivers and streams. Read part 1 in this series.
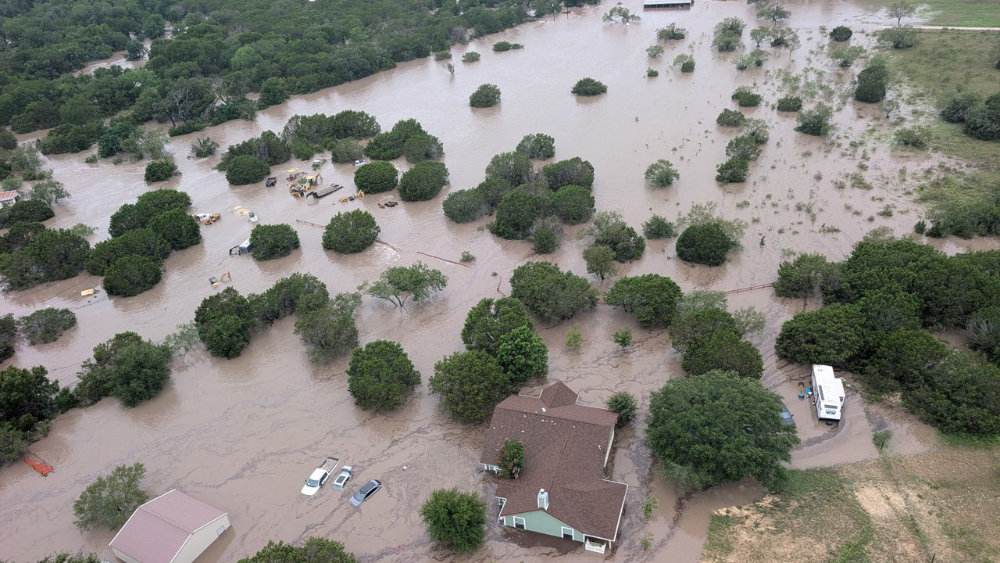
After Deadly Texas Floods, New Research Using Model My Watershed Shows How Land Use Alters River Flows

A year after devastating flooding swept across parts of Texas, questions about rivers remain as urgent as ever. How do watersheds shape river flow? How have decades of development and changes in land use altered natural flows? And what should those rivers look like if we hope to restore them?
Finding answers often requires looking backward.
In a recent study published in River Research and Applications, researchers reconstructed the historical hydrology of rivers across Texas to better understand how those rivers once flowed and how they might flow again.
To do it, they relied in part on Model My Watershed, an open source tool developed by Stroud Water Research Center.
Every River Begins Upstream
A river is more than the water flowing between its banks. It is the product of everything happening across the landscape that drains into it.
Rain falling on forests, farms, and cities eventually makes its way into streams and rivers. It either infiltrates into the ground and slowly travels downhill through soils and groundwater aquifers or it collects on the ground surface and runs downhill over the land surface. The entire landscape forms a watershed, and the land surface in that watershed determines which pathway water will take.
Understanding that watershed — its boundaries, land cover, soils, topography, and stream network — is foundational to understanding how a river behaves during storms. Because surface runoff moves quickly, flash floods can occur when fast and heavy rain follows this pathway to rivers.
Before researchers can analyze flows at a given location, they need to know which land area drains to that point. That’s one of the things Model My Watershed helps scientists do.
With just a few clicks, researchers can map a watershed’s boundaries, model land use changes by adjusting landscape characteristics, and access the data needed to analyze how much surface runoff is generated by the watershed.
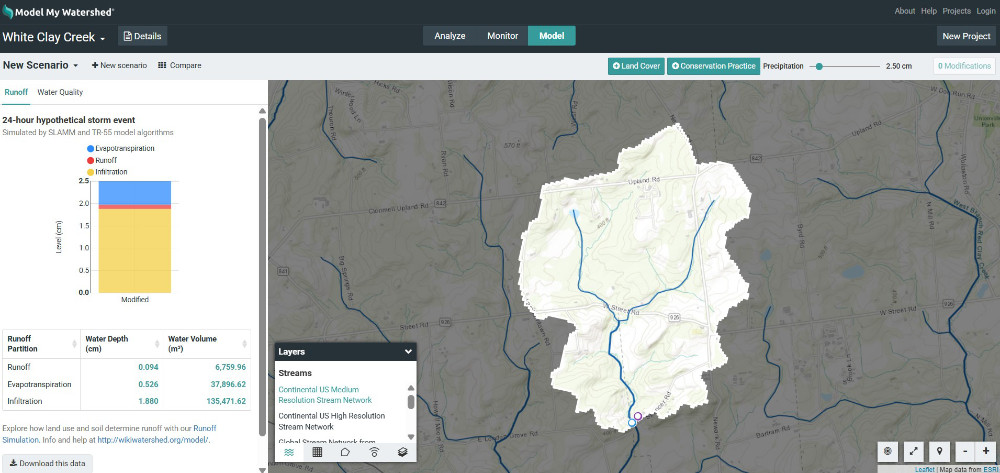
For the Texas study, Model My Watershed’s application programming interface, or API, was used to delineate the study watersheds, establishing the geographic boundaries needed to reconstruct historical river flows across Texas.
Reconstructing Rivers of the Past
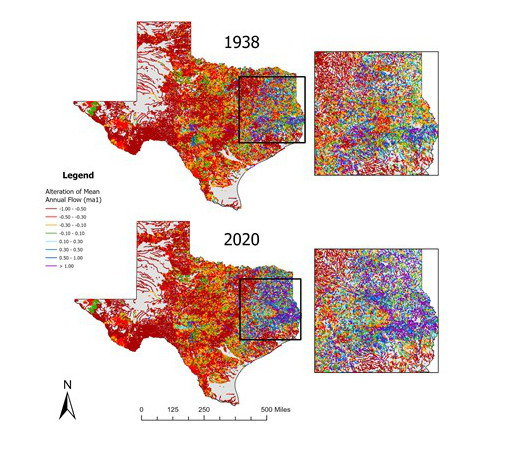
The goal of the Texas study was to estimate how rivers behaved throughout nearly a century of human modifications and through modeling, predict how development and land use changed the timing and volume of water moving downstream. Those historical estimates provide an important benchmark for measuring the quantity, quality, and availability of water needed to sustain communities and healthy river ecosystems today and into the future.
Reconstructing historical conditions requires careful hydrologic modeling, and hydrologic modeling begins with understanding the watershed itself, so the researchers used stream discharge data from more than 900 stations in the USGS National Streamgaging Network, assembled key landscape information that supported their analyses, and used Model My Watershed to delineate watersheds across Texas river basins.
What they discovered was a trend toward conditions that increase the potential for flooding and degraded river ecosystems, especially in eastern Texas. And what was the strongest predictor of whether rivers would exceed their optimal flows? Land use.
Building Infrastructure for Freshwater Science
Big scientific discoveries are often revealed in peer-reviewed journal articles and splashy news headlines. Less visible are the tools that make those discoveries possible. Tools like Model My Watershed.
Model My Watershed is part of the award-winning WikiWatershed Toolkit, a suite of open source applications developed by the Stroud Center to help researchers, educators, conservation practitioners, and communities better understand and manage water resources.
Beyond watershed delineation, Model My Watershed can also estimate how rainfall is partitioned among surface runoff, evapotranspiration, and groundwater recharge. It does not, however, route runoff through a watershed or show the path that water takes downstream.
Like the Stroud Center’s open source ORCA flood-monitoring unit and EnviroDIY Monitoring Station, both of which use the Mayfly Data Logger, these tools are designed for anyone working to understand freshwater systems.
The philosophy is simple: When high-quality scientific tools are freely available, more people can do science that protects fresh water. Researchers can reproduce methods. Communities can access sophisticated analyses without expensive proprietary software. Students can learn using the same tools as professionals. Conservationists and community leaders can make better-informed decisions.
The impact extends far beyond the organization that built the software.
Free or Low-Cost to Use Doesn’t Mean Free to Build
By building and maintaining open tools like Model My Watershed, the Stroud Center enables researchers worldwide to ask better questions, produce better science, and make better decisions for the rivers we all depend on. While it’s currently free to use, it isn’t free to build and maintain. It requires ongoing investment. To support science today for water tomorrow, donate now.
About the Author
Diane Huskinson is the associate director of communications at Stroud Water Research Center, where she leads strategic storytelling that strengthens public understanding of freshwater science and builds support for protecting rivers and streams. She serves as the Stroud Center’s lead narrative voice, editor, and brand steward — shaping how the world sees and values the only independent, nonadvocacy research organization dedicated solely to freshwater ecosystems.